
This is a review of PyCharm 2.7 that covers all of the features of the editor that I have used on a near-daily basis over the past year. My perspective is that of a professional (and hobby) software developer, occasional open-source contributor and former happy user of Vim.
Wait! There is newer version of this post that covers PyCharm 3.
About text editors and me: I’ve configured the crap out Vim, Emacs and Sublime Text 2, used many plugins and written some of my own, and read Learning the vi and Vim Editors for fun. On my quest for the One True Editor I’ve frequently dipped into lots of other editors and IDEs, so I may draw some non-Vim comparisons in this review.
I don’t believe there is One True Editor anymore, and this review isn’t about claiming that PyCharm is it. What I will do is share the features of PyCharm that I’ve come to rely on and haven’t been able to replicate in other editors.
In summary: PyCharm, with the IdeaVim plugin, offers enough parity with Vim to make me happy despite having a few warts, while the editor’s code navigation, refactoring tools, test runner, debugger and other features I will discuss in this review keep me more focused and joyful than I have ever been writing code.
Basic Facts About PyCharm
Most Python programmers have heard of PyCharm by now. It is an IDE created by JetBrains for use with Python, JavaScript and HTML. I’ve used versions 2.6 (which I started with last year) and 2.7.
A short list of features include most of the Holy Grails I spent so much time tweaking Vim to provide: highly intelligent code completion and navigation, project management, refactoring and more.
One of the great things about PyCharm is that most of these features also work with JavaScript.
Plugins are written in Java or (I think) Kotlin.
PyCharm receives multiple updates every year, which include new features, performance enhancements and bug fixes. It costs $199 for a corporate license or $99 for a personal license, with a few other license types available. The company often has limited-time promotional discounts throughout the year.
The editor is closed-source, but is built on the Intellij IDEA platform, which has an open-source Community edition.
A Note About Screenshots
Except where noted, all screenshots are taken using the following setup:
- A color scheme based on Solarized Dark
- The “Darcula” (sic) UI theme (new in PyCharm 2.7)
- The Inconsolata font
- OS X
Vim Emulation with IdeaVim
Alright, I know what you came for. Vim versus PyCharm, fight!
Any IDE or editor I pick up has to have good — really good — Vim emulation. And by that I mean I expect it to provide much more than vi keybindings. I want an ex command line, rich support for text objects and great search and replace.
PyCharm nails it. JetBrains develops a plugin especially for Vim emulation called IdeaVim that works with all Intellij IDEA-based editors, including PyCharm. They have a good list of Vim features the plugin supports.
The best part about this plugin isn’t that it’s open source. That honor goes to it having a committed JetBrains developer. Their man Andrey Vlasovskikh is pumping out features and bug fixes all the time.
What it Feels Like
Nothing can replace Vim, but IdeaVim feels closer than any other editor’s attempts. After you spend a while learning PyCharm’s commands and remapping them, you can get a pretty good hybrid of Vim-style commands and custom mappings.
Note: If you tried PyCharm before and found IdeaVim lacking, I strongly encourage you to try it again now that Andrey is on the scene.
Downsides
I expect and desire more from this plugin in the future, especially an easier way to create custom modal key bindings. For now you must use the editor’s standard key binding mechanism rather than one geared to the peculiarities of the modal interface created by IdeaVim.
Because of this, I have some keyboard shortcuts that feel like they belong to Emacs (Control-X, Control-R to launch the “Run…” menu, etc.) where I’d prefer to use a leader + key combination geared to a specific editing mode. (Only Vim users will understand that sentence.)
Code Completion
Let’s get into the meat of the review by starting our feature breakdown.
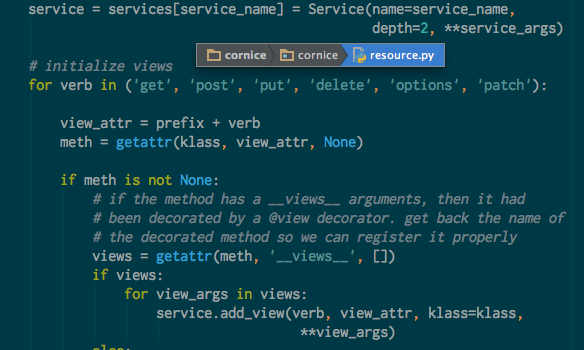
Code completion is very good. Here is a screenshot of me editing code from the open-source Python library Cornice:
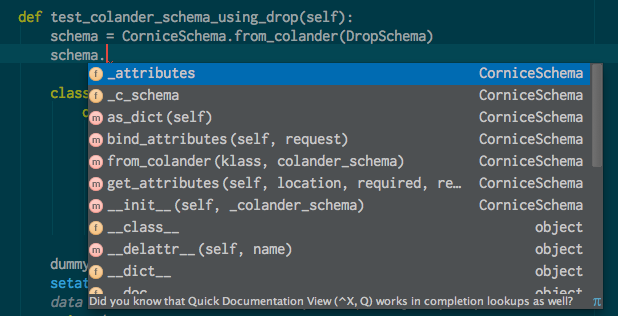
PyCharm displays fields of the object’s class (_attributes is a field of CorniceSchema) first, followed by fields and methods of its superclasses.
Once you trigger this completion menu, you can type letters to narrow down the selection. E.g., typing “_att” here would reduce the list down to the first field.
What it Feels Like
I’ve used completion features before in Vim and Sublime Text 2, using the “rope” library or matches from symbols across a project or in all open buffers. There is a big difference in how these features feel. Rope-based completion was always unreliable, slow or both. Completion features like Vim’s ability to match symbols across all open buffers are fast, but they feel built on an outdated tooling metaphor. Their unit of work is text.
PyCharm’s completion, on the hand, seems to operate on the meaning of code in a way that is more reliable and robust than Rope’s, and works with JavaScript too. You feel that you’re using an intelligent and well-engineered tool built for the future of programming — editing code, not text.
Downsides
What I miss about Vim is its ability to complete words anywhere: in docstrings, arbitrary strings and comments. PyCharm’s completion stumbles here and can’t seem to complete the name of the class you’re working on if you refer to it inside of a docstring.
In other words, a keyboard shortcut that will take you to the definition of a symbol.
When I want to go to a symbol by name, I type my keyboard shortcut for the “Goto Symbol” command, which asks me for a symbol name and filters down the symbols found in the project and in all its dependencies:
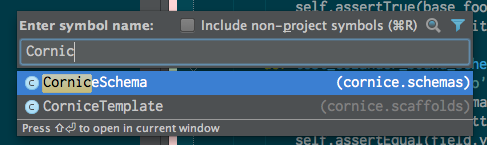
In the above screenshot, I triggered “Goto Symbol” (Command-R in my setup) and typed “Cornic”, at which point it completed to two different symbols. I hit the Enter key to immediately open the cornice.schemas module and arrive at the definition of CorniceSchema.
I could have used a special click combination or keyboard shortcut to trigger this command on any symbol in an open file.
I use this feature all day, every day to review APIs and docstrings of library code I’m using. It’s simply indispensable. But the best part is that it works well and consistently.
What it Feels Like
This is the feature I’ve had the most trouble getting other editors to do well. Vim and Sublime Text 2 with the “rope” library and some integration tweaks — or PyDev in Eclipse — can sometimes give you decent navigation. However, I’ve used all of these extensively and they all failed several times a day. Furthermore, it was not always clear why they failed. The end result? Sadness, anger and a sense of Primitive Humanity falling to darkness.
PyCharm, on the other hand, just works. The feeling is that a team of smart people engineered a product to make your life easier. You feel supported. Then eventually you forget that the feature is even there, and you expect to be able to jump to definitions in any editor.
Downsides
I haven’t found any. It’s badass.
However, there are rare occasions when PyCharm can’t wade through all of the metaclass magic or whatever a framework is doing to define a symbol, and it fails. But these are extremely rare in my experience and generally not a problem with frameworks the editor has special support for, e.g. Flask and Django.
Running Tests
PyCharm’s test runner helps me achieve an uninterrupted flow state while writing tests. For what seems like a simple feature, it has a huge impact. I’ll try to explain by talking about my experiences with other editors.
You may have a nice system going with Vim or ST 2 — maybe it involves a Tmux pane dedicated to running tests, or a command that you run in the editor that shells out to Bash or Z Shell. Maybe you just switch back and forth between an editor window and the shell. I tried all of these.
Ultimately, your workflow is probably something like “write tests, switch focus to command-line interface, execute the last command or type a new command to run a specific test or suite, examine output, if an error occurs note line number, switch focus back to editor.”
After using PyCharm, I will never go back to this workflow.
In PyCharm, if I want to run a test I’m working on, I hit a keyboard shortcut that detects the test my cursor is within and offers to run or debug it. The small window that pops up looks like this:
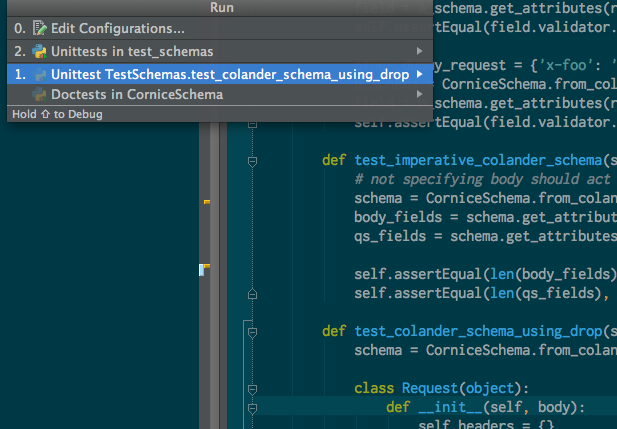
I can type the number 1 or Enter key to run the test, the number 0 to run all unit tests in the current module (test_schemas in this example), or the right arrow key for more options. Here’s an example of the contextual menu that opens when I hit the right arrow key:
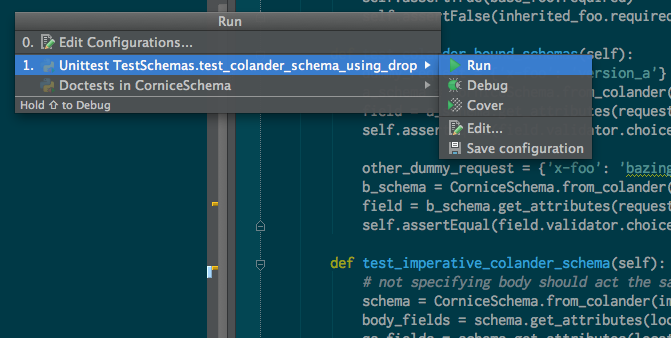
The default action is run, but I can debug the code (which will allow me to stop at breakpoints in my code or in library code), or I can run a coverage report. I also have a keyboard shortcut that launches a similar window but uses Debug as the default action instead of Run.
So here’s what it looks like when I run the test:
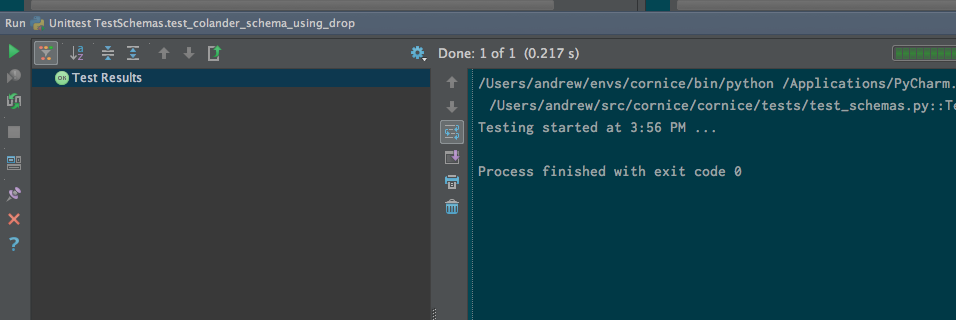
A new editor pane slides into view (I have mine docked to the bottom of the window). It shows a summary of test results in the left side (“OK”), the number of tests it ran, the time tests took to run and any output.
Seems simple, right? After using this feature for a year, I can’t live without it. Here’s why:
- Keyboard shortcuts to jump back and forward between the tests you run (if you ran a suite)
- A keyboard shortcut that reruns the last test immediately (no context switches required)
- Each frame of a stack trace in test output is a link that opens the line in the text referenced in that frame. So simple, and yet I want to give JetBrains $100 for doing this.
A coverage report looks like this:
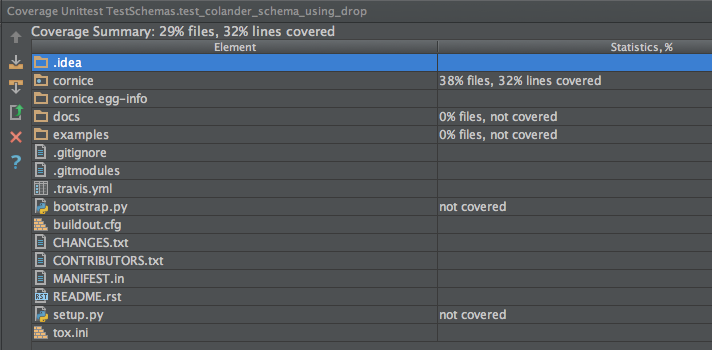
The coverage report is nice, but sort of bells-and-whistles. I rarely run it because I’m not often checking coverage as I work.
What it Feels Like
What I hope to convey about the test runner is that I can spend a couple of hours working in a single window, writing code, running tests, checking output, jumping to specific lines of a stack trace, setting a breakpoint and debugging a test — all without having to switch contexts.
Smoke up your bum? No. It may sound like I still “switch contexts” in the moment that the editor asks me for input about how to run a test, but it actually feels like an extension of my will. I don’t even notice that PyCharm is doing anything — I’m focused on the code under test, the test and its output. I never found that experience using an editor plus command line interface, even after writing a test runner plugin from scratch for Sublime Text 2.
Downsides
All of that devotion aside, there is one downside to the test runner. When you rerun a test, the output from the last test run is cleared away. That is unfortunate because when I’d rather not fool with the debugger, I use print statements to check on misbehaving state, and sometimes it’s helpful to see changes over the course of running a test multiple times.
I hope someday there will be a “persistent output” option, like in Chrome’s console. Maybe I should open a ticket for that…
Debugging
I used to feel pretty elite doing all of my debugging in ipdb and the command line. I had a keyboard shortcut in Vim that would inject an “import ipdb; ipdb.set_trace()” statement on the current line. Then I’d go to town.
At first I wasn’t super impressed with using PyCharm’s graphical debugger, compared to my experience with ipdb. It’s grown on me over time, though, and now when I try to use ipdb I feel that old sadness for Primitive Humanity.
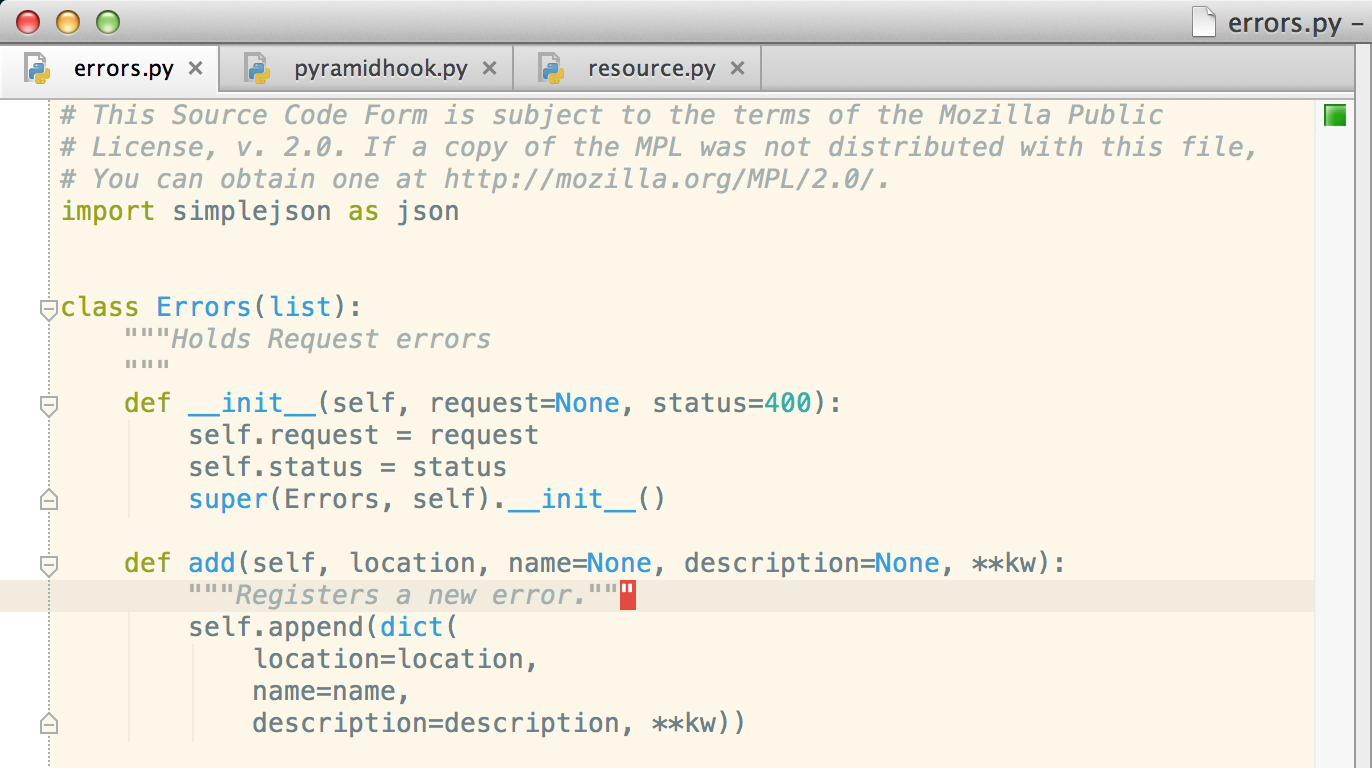
Before I explain why I like the debugger better than ipdb, let me show you a screenshot of me debugging Cornice:
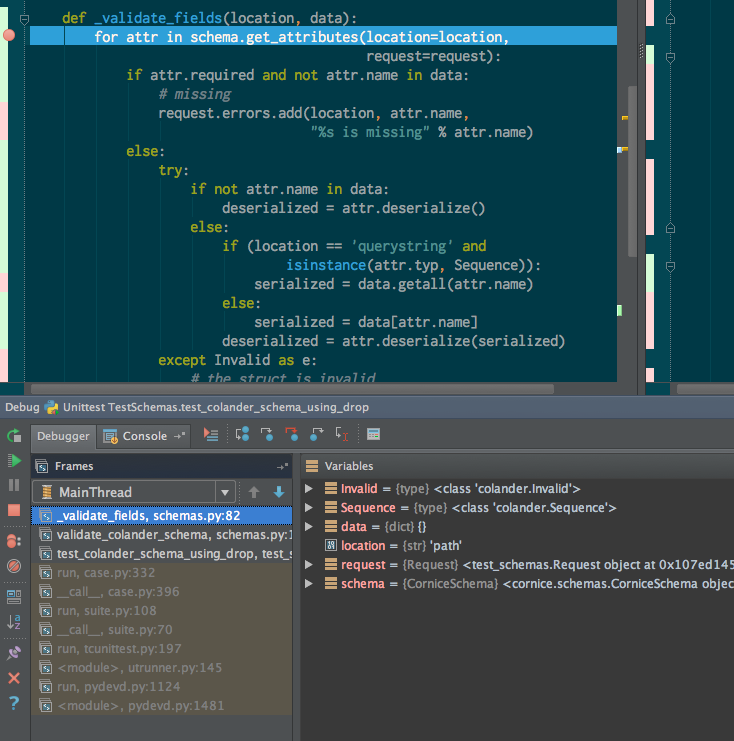
So, let’s talk about the screenshot. I’ve set a breakpoint on the blue line with the red dot on it (too bad I cropped the line number out of the screenshot, right?) and ran a test that triggered the code in the current frame.
PyCharm’s debugger is paused in _validate_fields. The current line is highlighted. Variables in scope are listed in the lower-right quadrant of the screen, next to the list of frames; both areas are part of a window pane that slid into view after I executed a “Debug” action within a test I was writing.
I can now interact with the state of the program visually, through the “Variables” tree, or imperatively using either the “Evaluate Expression” command or an interactive console session akin to ipdb. These are all useful tools, so let’s examine them in more detail.
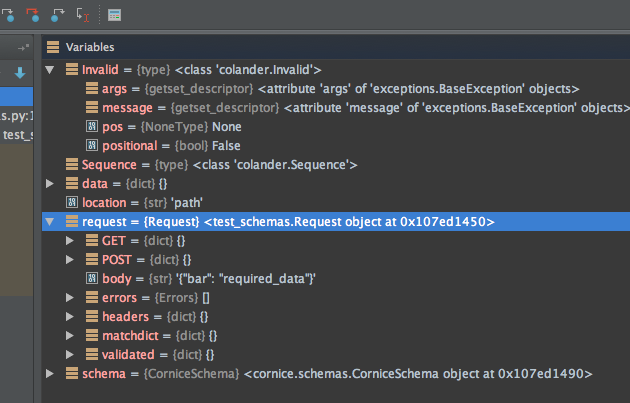
In the following screenshot of the “Variables” the tree you can see the container object request expanded to show its members (this doesn’t always work, and I’m not sure why):
The following is a screenshot of what running the “Evaluate Expression” command looks like:
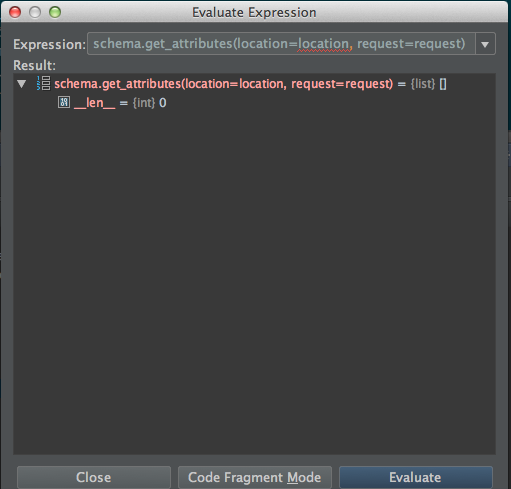
This dialog window opens up in front of the editor. It isn’t modal, so you can continue to interact with your code or the debugger behind it.
The “result” portion of the window shows the return result of the expression after you click “Evaluate.” Standard output appears in the “Console” window, which I’ll show in the next screenshot. You see the exception class of any exception raised by the the expression, but not a stack trace. “Code Fragment Mode” lets you write more than one line for your expression.
The other way to interact with the running program is through the “console.” While there is a keyboard shortcut to launch “Evaluate Expression,” I haven’t found one for the console, which seems to require two mouse clicks (ugh!).
First you have to click on the “Console” tab of the debugging window, which looks like this:
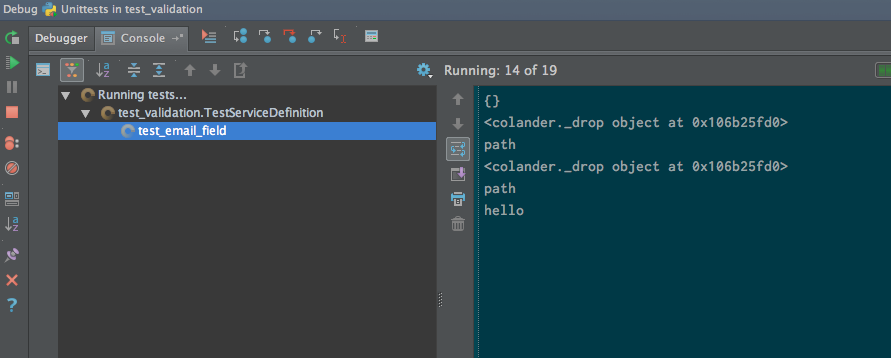
Here you can see standard output from the code currently being debugged. (My screenshot is of different code than in the last screenshot.) The console window to the right is where standard output from any code executed in “Evaluate Expression” appears.
To make the console interactive you have to click the “Show command line” button on this window (ugh! WTF! I just clicked “Console”!). Which drops you here:
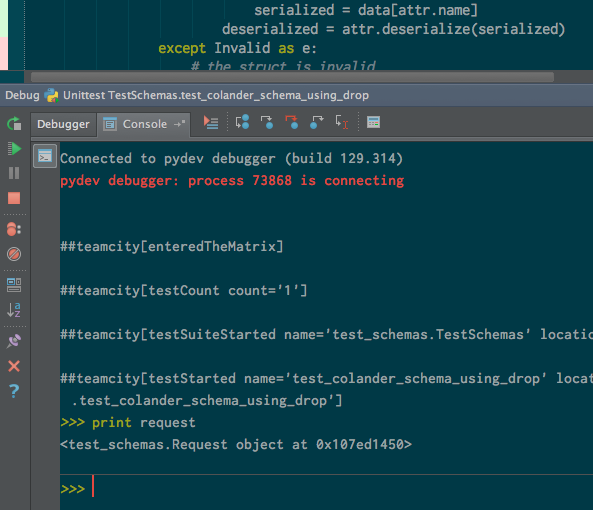
Before you ask, I don’t know what the “##teamcity” stuff is about. TeamCity is a continuous integration product that JetBrains makes, and which I’ve never used.
So, back to the “Console/Command Line.” This is like an ipdb session where you can use Python to interact with your Python — except that you can’t control the debugger using text commands. I spent a lot of time in this window when I first started using PyCharm’s debugger, and it’s pretty nice, but not much better than “Evaluate Expression.”
What it Feels Like
In a sentence: ipdb on steroids.
I like it better than ipdb for the same reason that I like the test runner better than using a command line — no context switches. As long as you stick to “Evaluate Expression,” you can remain in a flow state while you debug the program, using only keyboard shortcuts. Check it out:
- Write some code
- Add a breakpoint using a keyboard shortcut
- Run a test in debugging mode using a keyboard shortcut
- Evaluate an expression using a keyboard shortcut
- Jump between frames using a keyboard shortcut; maybe evaluate more code
- Close the Debug window using a keyboard shortcut
This is a pretty nice debugging workflow and it beats the hell out of switching to a terminal window and interacting with ipdb. I don’t have to think about ipdb’s wacky command line interface — e.g., how to print more or less lines of code around the code I’m debugging after I run the “line” command a couple of times, or any of that other annoying stuff that ipdb forces on me. I’m in there looking at some state, then I’m back out ASAP and working again.
Downsides
No keyboard shortcut (that I’m aware of) to launch “command line” mode of the Console while in a debugging session.
Code Generation
PyCharm has a feature called “Intention Actions” that provide automated solutions to known problems the editor detects in your code. “Problem” may be the wrong word, as these situations may be problems, such as using a symbol that isn’t found in the current scope, or they may be small refactors that can make your code better, or they may simply offer a helping hand, e.g. by generating a documentation stub.
According to the docs, there are three types of Intention Actions: “Create from usage” (missing symbols), “Quick fixes” (problems your in your code) and “Micro-refactorings” (e.g. convert lambda into function def).
When an Intention Action is available, you will usually see some indicator in either the status bar on the bottom of the window, the text itself (if it’s a syntax error or unresolved symbol) or both. Then you can use a keyboard shortcut to trigger a menu of actions available.
Whew, that was a lot of detail. The point is that these actions usually generate code. In the following screenshot I typed the symbol “Request” and PyCharm could not find it in scope, so I triggered the Intention Action menu with a keyboard shortcut:
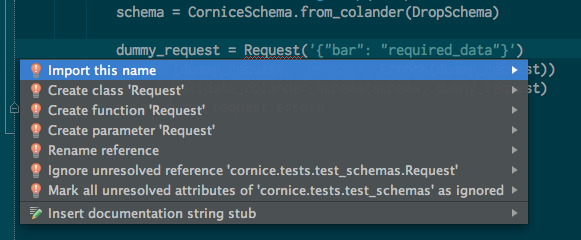
I’m given a few options. The most common is that I want to add an import statement for an unresolved symbol, but I could also create a class, function or parameter. Hitting the right-arrow key on any of these will present further options, such as where in scope I want to add the new code (e.g., in the current function, class or module), and enter will use a default.
I don’t often create a class or method with this feature, but I do regularly use it to fix errors and add import statements.
What it Feels Like
This might seem like a bells-and-whistles feature, or even bloat — which is what it feels like in Vim when saving a large file causes a 1 – 2 second delay for syntax checking. However, on a 2008 MacBook Pro, I rarely experienced lag that appeared to be caused by this feature. And the editor hums on more recent hardware.
Instead of annoying, this feels like pair programming with an observant coworker who has memorized Python syntax, a small dictionary and PEP8. Who you can tell to shut up without any social retribution.
Downsides
None. However, I assume this feature will make you sad if you run PyCharm on a Linux machine with 4 GB of RAM or less, but I wouldn’t recommend that for other reasons (fonts, as I’ll discuss later).
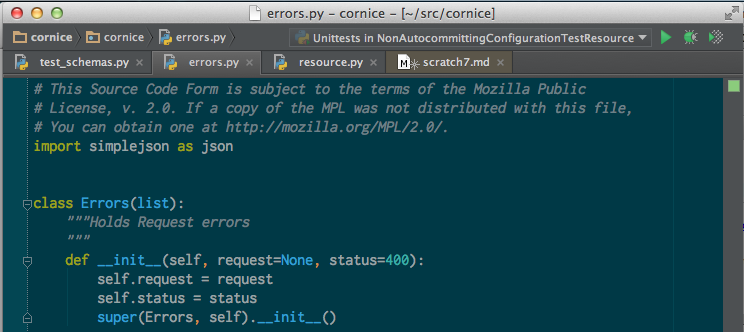
Error Detection and Resolution
PyCharm detects several types of errors in your code and will offer to fix them for you. These include the types of errors that you probably already use pylint to check for in your editor of choice: syntax errors and PEP8 violations. It also detects spelling mistakes with what appears to be a very limited dictionary.
Beyond these simple scans, the editor “knows about” Python in the sense that it can detect common design mistakes, like not closing a resource, and offer automated solutions. It can also detect alternative style choices, like single-versus-double quotations, and offer to change between them.
Erroneous statements are underlined with a red squiggly line by default, but this is configurable. One of the options in the Intention Action menu for an error is to silence it. You can also configure whether PyCharm should check for spelling errors in code, or in comments only (or never).
What it Feels Like
This is a great feature that I won’t spend too much time on because I’ve already partially described it in “Code Generation.” As with that feature, it feels like working with a pedantic-yet-helpful pair programmer.
Downsides
Same as “Code Generation.” Running background error detection on code as you write it is probably resource-intensive, especially for thousand-plus-line-files. I haven’t had any problems though.
Refactoring
If you haven’t used refactoring tools before, this is a feature that automates the rather laborious process of doing things like renaming a method or variable that may have dozens or hundreds of usages across a project.
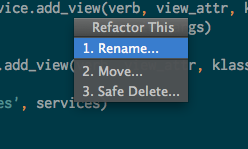
Doable with ack (or grep) and Vim. But would I want to go back to that life? No. Here’s why — let’s say I want to rename a method with a name like “add” that’s guaranteed to give me false positives from a text-based search like grep. In PyCharm I trigger the refactor menu with a keyboard shortcut:
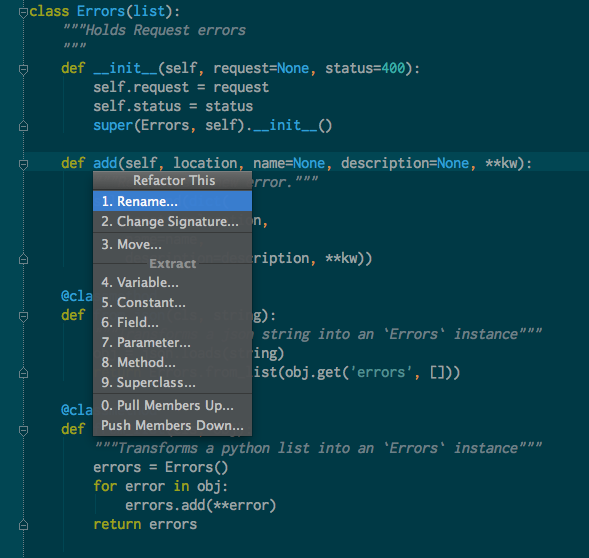
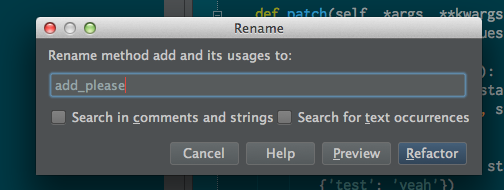
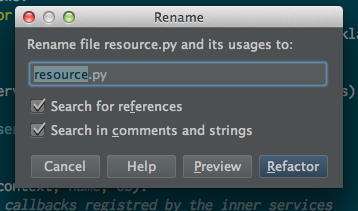
Alright, great. I have tons of refactoring options. I’m only going to show renaming because that is what I do the most. So, I hit the Enter key on “Rename…” and I’m asked for the new name:
What’s that “Preview” button? Oh, it’s just a sweet tree containing all the occurrences of the symbol:
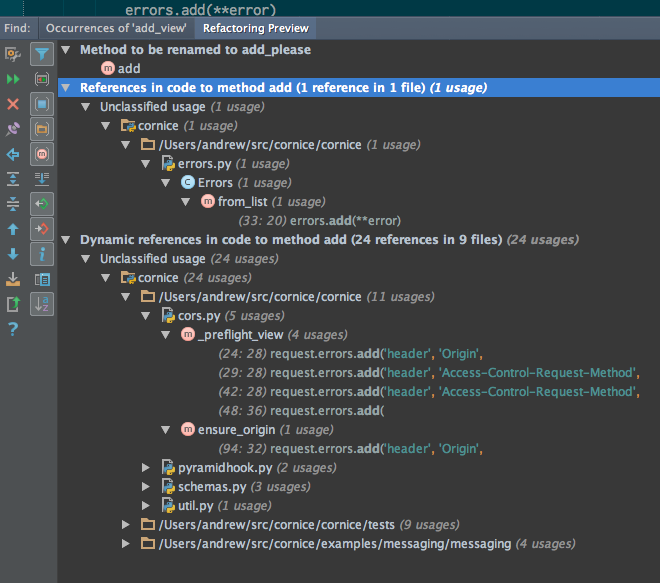
From the preview, I can right-click on any branch of the tree and exclude all sub-items from the operation. There’s a button at the bottom (not in the screenshot) that lets me cancel or do the refactor.
If I want to undo the refactor, all of the changes are rolled up into a single undo, and I get a special dialog box (“Undo renaming method to add_please?”).
What it Feels Like
The future. Seriously. I believe that the industry will continue to build more intelligent tools — not “text editors” anymore, but development environments that have a deep machine understanding of how languages, frameworks and platforms work. PyCharm’s refactoring tools feel like just the tip of this iceberg, and yet they still blow away the alternatives. And you can refactor JavaScript, too.
Downsides
None that I’ve found.
# Window and Split Management
Personally, I won’t even use an editor that can’t split editor panes well (I’m
looking at you, Eclipse).
So, there’s good news and there’s bad news.
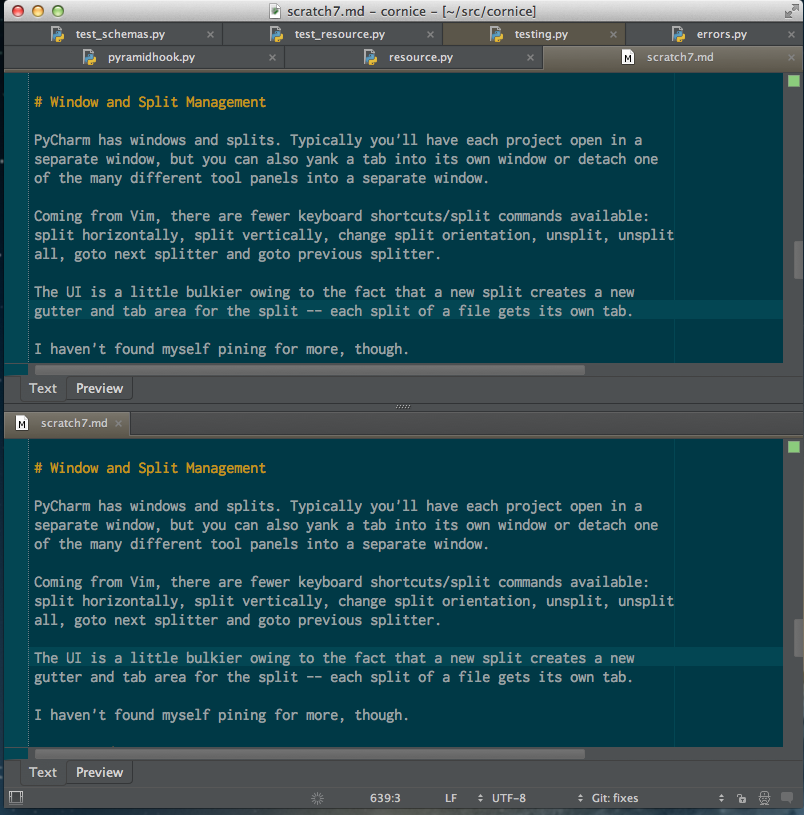
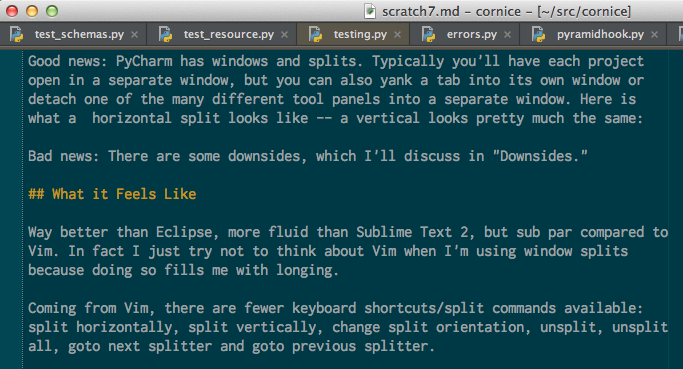
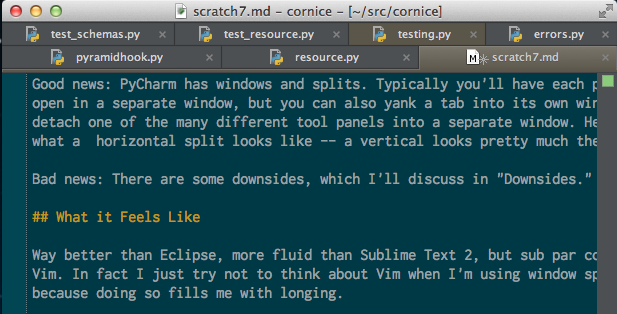
Good news: PyCharm has windows and splits. Typically you’ll have each project
open in a separate window, but you can also yank a tab into its own window or
detach one of the many different tool panels into a separate window. Here is
what a horizontal split looks like — a vertical looks pretty much the same:
Bad news: There are some downsides, which I’ll discuss in “Downsides.”
## What it Feels Like
Way better than Eclipse, more fluid than Sublime Text 2, but sub par compared to
Vim. In fact I just try not to think about Vim when I’m using window splits
because doing so fills me with longing.
Coming from Vim, there are fewer keyboard shortcuts/split commands available:
split horizontally, split vertically, change split orientation, unsplit, unsplit
all, goto next splitter and goto previous splitter.
I haven’t found myself pining for more commands, though, so I don’t consider
this a downside, just something to mention.
The UI for splits is bulkier than Vim owing to the fact that each split creates
a new gutter, margin and tab area, and each file in the split receives a tab.
## Downsides
Window splits are not quite the smooth-as-butter experience that I remember from Vim. The biggest problem I have is with opening a file from one split that is already “open” in another split.
If you do this in PyCharm, your cursor will jump to whatever split the file is already open in. Vim would just open the file in the current split, which is the behavior I’ve come to expect. At the very least I’d like this to be a configuration option.
# Managing Open Files
PyCharm represents an open file with a tab. I didn’t use tabs with Vim, so at
first it seemed like JetBrains had dumped something foul in my cereal. Now
they’ve grown on me — in large part because of the tools the editor includes
for jumping between open and recent files.
## Tabs
Here’s what a single row of tabs looks like:
By default, PyCharm will continue to stack editor tabs on new lines as you add
files, so you can see all open files clearly:
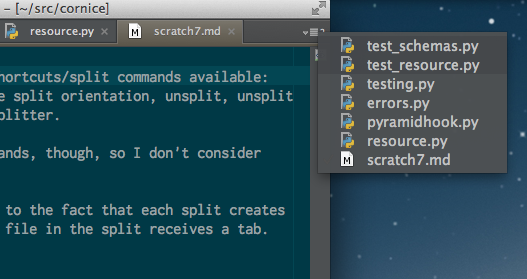
You can also configure it to keep tabs to one line, which hides the lesser-used
tabs in the current editor instance (each split is an editor instance):
Then you get a little button that opens a list of all the tabs (and I believe you can configure a keyboard shortcut for this too):
If you desire ruthless efficiency, you can set a “tab limit” that defaults
to ten. If you open more than that number of tabs, PyCharm start closing old
ones. You have a couple of options for the tab-closing strategy.
BUT WAIT, THERE’S MORE.
## Jumping to a Recent File or Tool Window
In Vim and Emacs I used plugins like bufexplorer and ibuffer (respectively) to
get an overview of open files and to quickly switch back and forth between them.
PyCharm has a couple of features like this. First is the list of recent files,
shown here triggered by a keyboard shortcut:
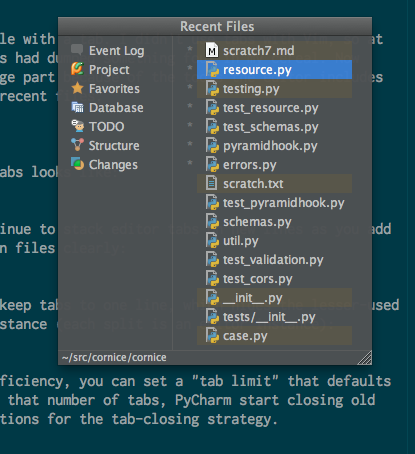
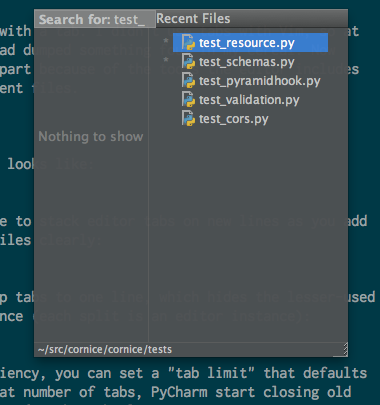
This list is searchable and defaults to the last file I had open. As soon as I
start typing, it filters down the list of items:
This is great because I don’t even keep track mentally of files I may have
opened 16 files ago — by then I usually just jump to the file by name, which
I’ll discuss in the “Managing Project Files” section. You could always do that,
but I find that the recent files list is faster.
Note that you can open a tool window by name from this window, not just files.
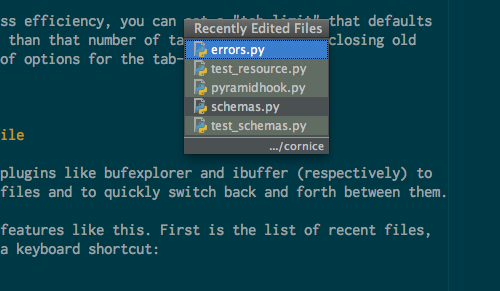
You can also view a list of recently *edited* files — not just ones that you
viewed, with a different keyboard shortcut:
There’s yet another way to show a list like this, too, which is called the
“Switcher.” This is basically like Alt-Tab or Command-Tab, where you hold down a
key combo and tab between options rather than search. I don’t use it.
## What it Feels Like
I don’t even notice these features anymore because they’re muscle memory. Most
of the time I’m using them to jump back and forth between a few open files I’m
working on — or more often, the immediate last file.
I for sure notice when they’re missing from other editors though…
## Downsides
I’m happy with a list of recent files, but I’d prefer an option to show all the
files open in the editor, like ibuffer and bufexplorer do. I’d also like to be
able to close files from the same menu.
# Managing Project Files
Get ready because these features pack heat. Well, at least one of them does (the navigation bar — keep reading).
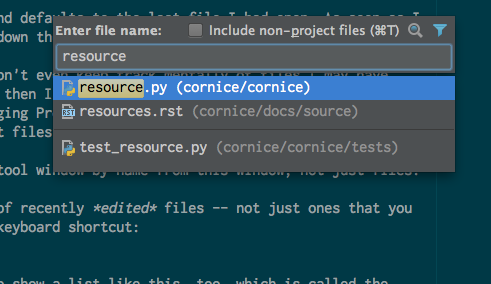
PyCharm lets you jump to any file in the current project using a fuzzy search,
like Sublime Text 2, Eclipse, Xcode and Vim with certain plugins. It works well
— maybe not quite as fuzzy as ST 2, but good enough. The UI is similar to “Goto
Symbol,” a list of partial matches that filters down as you modify your search
text:
I use this all day, when I’m not using the Recent Files menu to open files.
If you like to see a tree of files, though, PyCharm has a comprehensive one that
works way better than Sublime Text 2’s and NERDTree in Vim:
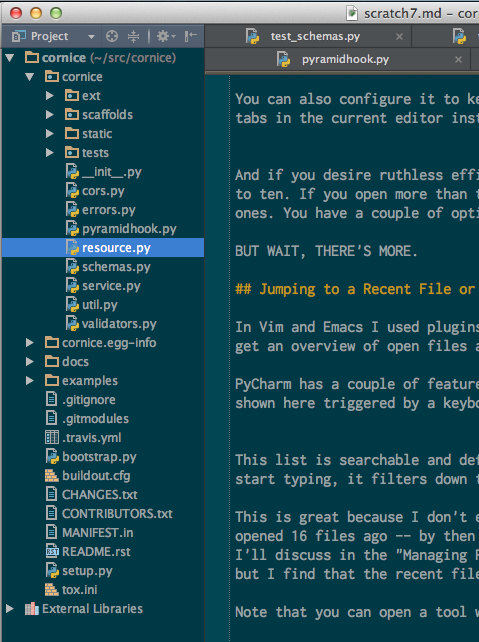
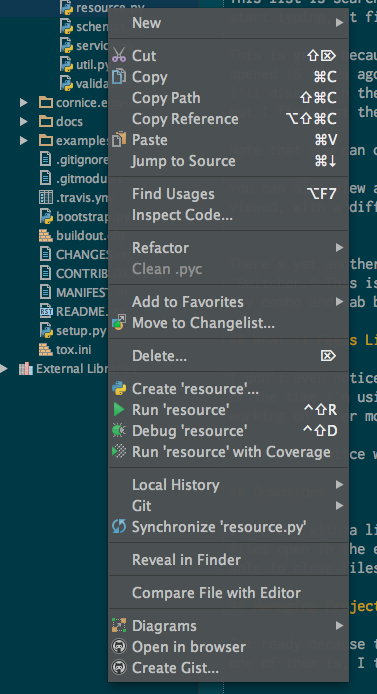
It probably looks like any old file tree, but it has quite a few options for
each file in a context menu opened by right clicking:
Honestly though, I never use this tree because there is something *way better*
called the navigation bar. I’m not sure how to describe this other than it’s
like a keyboard-navigable breadcrumb file tree. I’ll have to show you — here is
what it looks like in its default position (I usually have it hidden by
default):
“Ugh, so crowded!” you probably thought. Yeah, I know, that’s why I have it
turned off. But check this out — you can still activate a special floating
version of the navigation bar with a keyboard shortcut:
And it does a great job of showing directory contents:
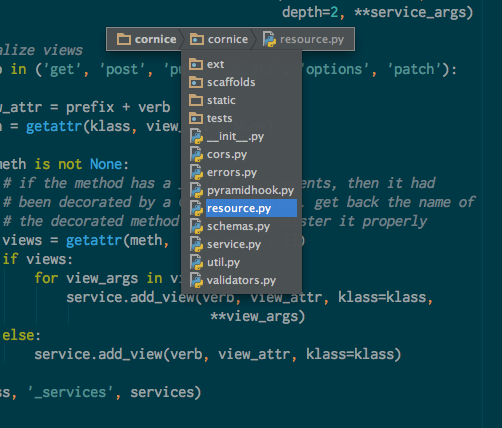
Meanwhile, PyCharm has refactoring options specific to files, which you can trigger directly from the navigation bar:
In this screenshot, I’ve triggered the “rename” refactor action for this file:
I’m not sure a few screenshots can convey how awesome it is that you can move,
rename and delete files all from the keyboard, without having to use a shell, sidebar
or tool window. Who at JetBrains was responsible for making this happen? I want to buy
you a rad stuffed animal.
## What it Feels Like
Like all of my favorite PyCharm features, this one simply fades into my
experience of editing — until I ever try to use another editor and I’m rudely
awakened. I can’t imagine pausing from a coding session to rename some files in
a shell or even a sidebar tree anymore, or *God forbid* doing anything other
than fuzzy search on recent files or project files to jump around.
## Downsides
None that I’ve found. These features are tight.
Reformatting Code
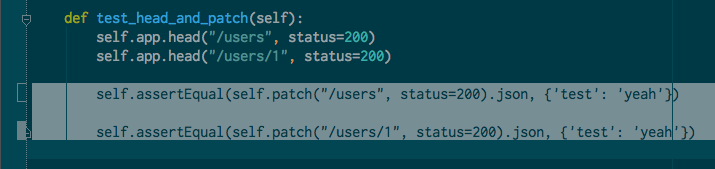
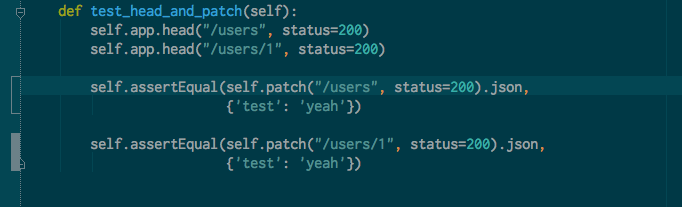
A seemingly insignificant feature — automated reformatting of selected code to configurable spacing and indentation rules — turns out to be another one I use all day. Here’s an example of me correcting spaces and indentation on a block of Cornice code — first I select the problematic lines:
Then I use my Reformat Code keyboard shortcut to fix the indentation:
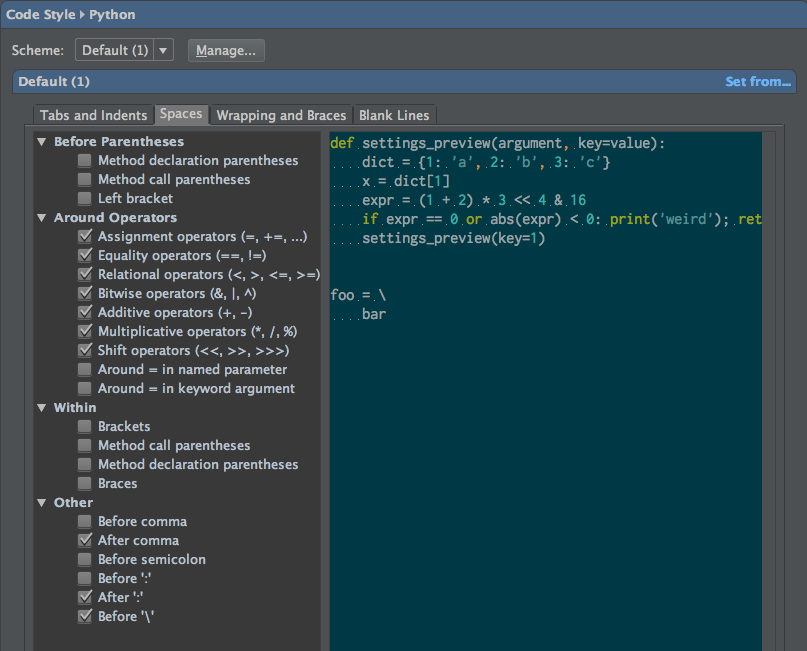
Each language has its own configuration section for this feature. Here’s a screenshot of Python’s:
What it Feels Like
Another unconscious extension of my will — that is, when it works.
Often, Reformat Code doesn’t understand how I want the reformat to happen because there are ambiguities — for instance, it won’t add a line break for each parameter in a method call to make it a bit more readable when that seems like the best thing to do.
Then there are just plain old errors, like the fact that it won’t reformat docstrings or comments to my configured column width (I had to write my own plugin to do that). Or that it occasionally it moves lines to the wrong indent level.
Still, I’ll often sweep whole function definitions with with Reformat Code as I’m writing, to clean up after myself, and then fix the one or two things PyCharm didn’t do quite to my liking.
I think I use this feature more with JavaScript than Python, and it works very well in those files, too.
Downsides
The inability to reformat comments and docstrings to a column width is a drag. They even released a separate feature that I thought was supposed to do this very thing — “Fill Paragraph.” Except that I could never get it to work, and at present the issue tracker has several bugs in various states against Fill Paragraph that seem not to be resolved.
Unrelated to my personal vendetta, the general sense that PyCharm can’t make everybody happy in ambiguous cases, even with configurable behavior for code style, is something I’m willing to accept. Would you expect your paint brush to paint the picture for you? I think not.
Color Schemes
Coming from Vim and Emacs, I’m somewhat dissatisfied with color scheme support in PyCharm. There aren’t many color schemes bundled with the editor, and the selection among community-created color schemes is thin in comparison with Vim’s.
I’ve also had trouble with a color scheme either lacking the option to change the color of some syntax, or using a color for a piece of syntax without giving me the option to change it (I lack a good example of that, but I remember it happened with CoffeeScript).
Still, there are upsides. There’s a nice graphical configuration panel that lets you override colors for different languages, and support for importing custom color schemes.
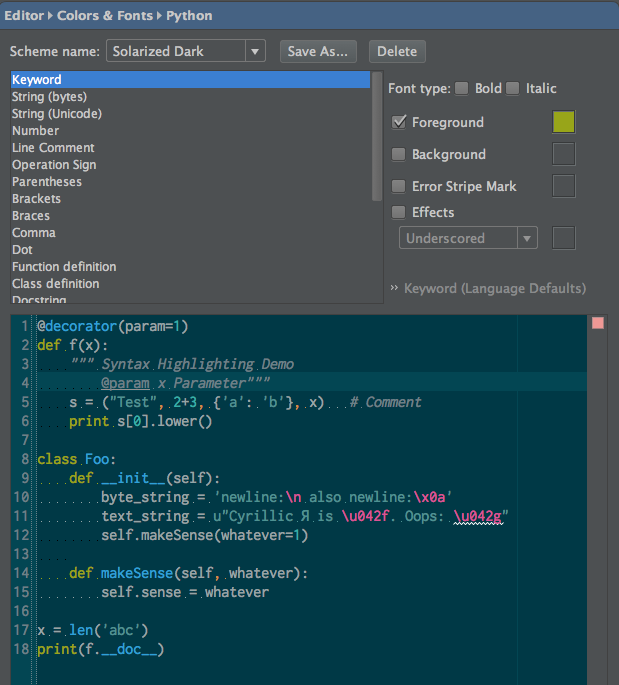
Plus, if you use Solarized, the One True Color Scheme, then you’re in luck because there are a couple of decent ports of the color scheme to Intellij-based editors (though I had to fiddle with the default colors in Python, JavaScript and CoffeeScript to avoid vomiting).
Here’s a screenshot of me editing colors for the Solarized Dark scheme and Python:
There is also a new feature called “Look and Feel” that affects your experience with the editor. The Look and Feel choice is a theme for the PyCharm UI chrome, like the tabs, gutter and status bar, which by default are all a metallic gray color.
In my screenshots I’m using the “Darcula” Look and Feel setting, but here’s a screenshot of me using Solarized Light and the default UI Look and Feel:
What it Feels Like
Adequate. The graphical configuration panel is a nice touch — and since you can export your color scheme overrides, you can include these customizations in your editor settings backups.
Downsides
Too few color schemes packages with the editor and too few available from the community. No way to discover new, non-bundled color schemes from within PyCharm.
Project Support
One thing everyone expects from an IDE is good project support, and PyCharm does this very well.
Creating projects is super easy, especially if you already have a directory of code and you just want to edit it with PyCharm. In that case, there is an “Open Directory” option that automatically builds a project configuration for a directory containing Python code. If the directory is under version control, PyCharm will detect this and ask you to confirm the location of the source control root (which it has detected). Usually the only step I need to take after that is to go into the project configuration and set a custom Python Interpreter, since I use Virtualenv — which indexes all of the symbols used for completion and navigation.
There is also a form wizard that you can use to create a new project from scratch.
When you open a new project (or directory), you can do so in the current window, which switches out the active project, or you can open it in a new window.
When closing and reopening projects, all of your files, window splits and window positions are restored. There is no “persistent undo” option like in Vim, so you can’t press an Undo keyboard shortcut and undo the last action you did before closing the editor. However, the editor’s embedded version control system, “Local History,” keeps track of all changes to files in your project, including loading external changes, so you can easily undo previous changes with a nice diff-like interface.
Code style settings are project-specific, so if you work on multiple open-source (or whatever) projects with competing style guides, PyCharm can cope with that, and you can use the “Reformat Code” command to automate keeping your work in line with the team’s style.
What it Feels Like
If you’ve used Sublime Text 2 or other IDEs, this is familiar ground, with a nice GUI and some extra Python-specific settings like the location of the project interpreter.
Projects in PyCharm feel like one unified piece of a collection of well-engineered features. They make the experience a little bulkier than with Vim, but the tradeoff is that you get all of the crazy-awesome contextual features like navigation and completion as a result.
Downsides
If you’re coming from Vim, then you might have mixed feelings about project support, since they are a metaphor central to PyCharm.
When I first started using the editor, I didn’t like to be so locked into the idea of a project. Opening random files from the command line seemed awkward because they opened in the current project. On the other hand, I spent a long time trying to get a decent project management workflow (managing a collection of files related to a single project) working in Vim without success. I tried sessions and project plugins, and none of my approaches worked well with all of my plugins correctly — one plugin would set the CWD to the current file, while another plugin needed CWD set to the project directory to work. Etc.
Ultimately, I’m happy to have project support and I can live with the fact that running charm <filename> opens a file in my current project. That seems like a logical choice.
Editing, Backing Up and Restoring Configuration
Project and IDE settings are configured using a graphical interface that is searchable. I’m not sure I prefer it over a text file, but then again, I don’t get syntax errors changing configuration anymore.
What I do miss is having a single source of configuration “truth” for my editor — like a .vimrc file — that I can place in version control and share among computers. With PyCharm, you can easily export and import your settings, but you have to remember to export them, and the resulting file isn’t exactly human-readable.
So, here’s what the settings panel looks like — there’s a searchable tree on the left side of the window (and there are more settings than I’ve included in the screenshot):
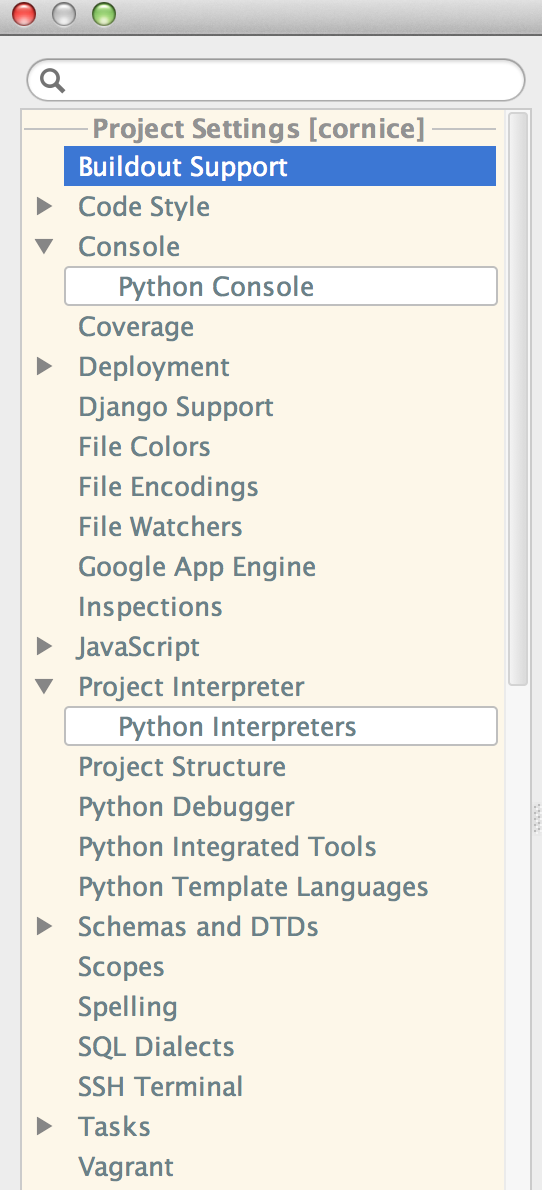
If you type in the search box, the tree live-updates by filtering down the list of panels to ones in which it found a hit:
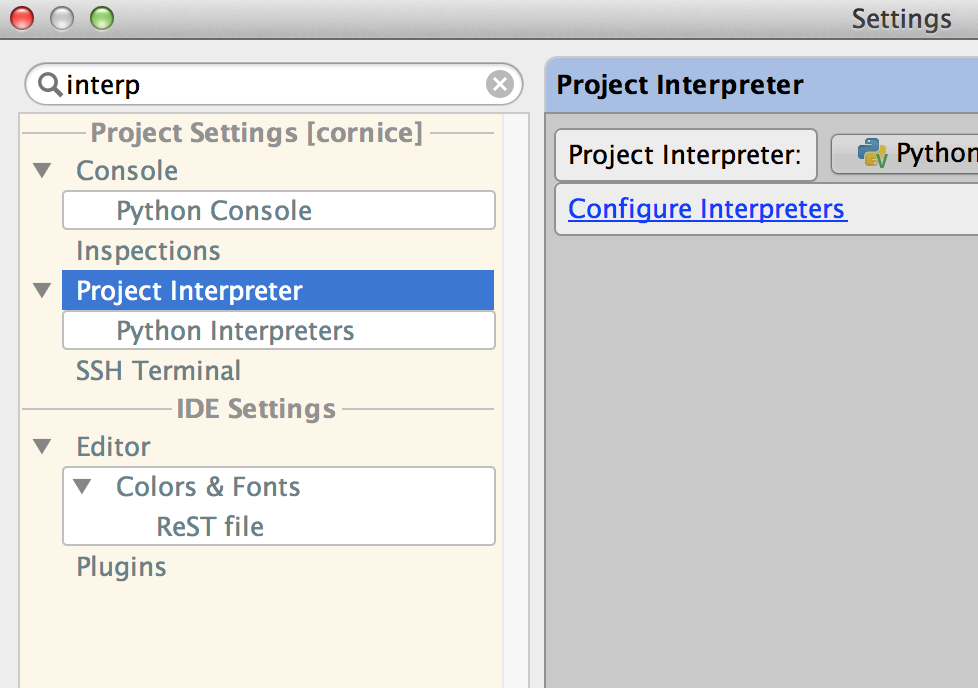
Then you … type in the boxes. It’s pretty straight-forward.
What it Feels Like
Belittling, to a Vim user, though the search feature is nice.
I like the option of having a GUI to modify settings, but I prefer editing a text file so I can easily keep it in version control. I also like having programmatic access to configuration options — switching options based on the current OS, just to take one example. Say goodbye to spending lots of time editing your configuration file.
Still, say goodbye to spending lots of time editing your configuration file. Seriously, I’m pretty sure you won’t miss it. I don’t.
Downsides
No central source of truth about editor configuration in a human-readable text file. You must use a GUI to change settings (though it’s a nice one).
Snippets
PyCharm comes with a yasnippet-like feature called Live Templates. You can find plugins for this type of feature in every editor, and it’s a must-have for languages like Java and JavaScript that require tons of boilerplate.
Anyway, it’s a decent feature and I’ve used it to create lots of little snippets. Here’s a screenshot of the configuration panel for Live Templates, expanded to show the default JavaScript templates:
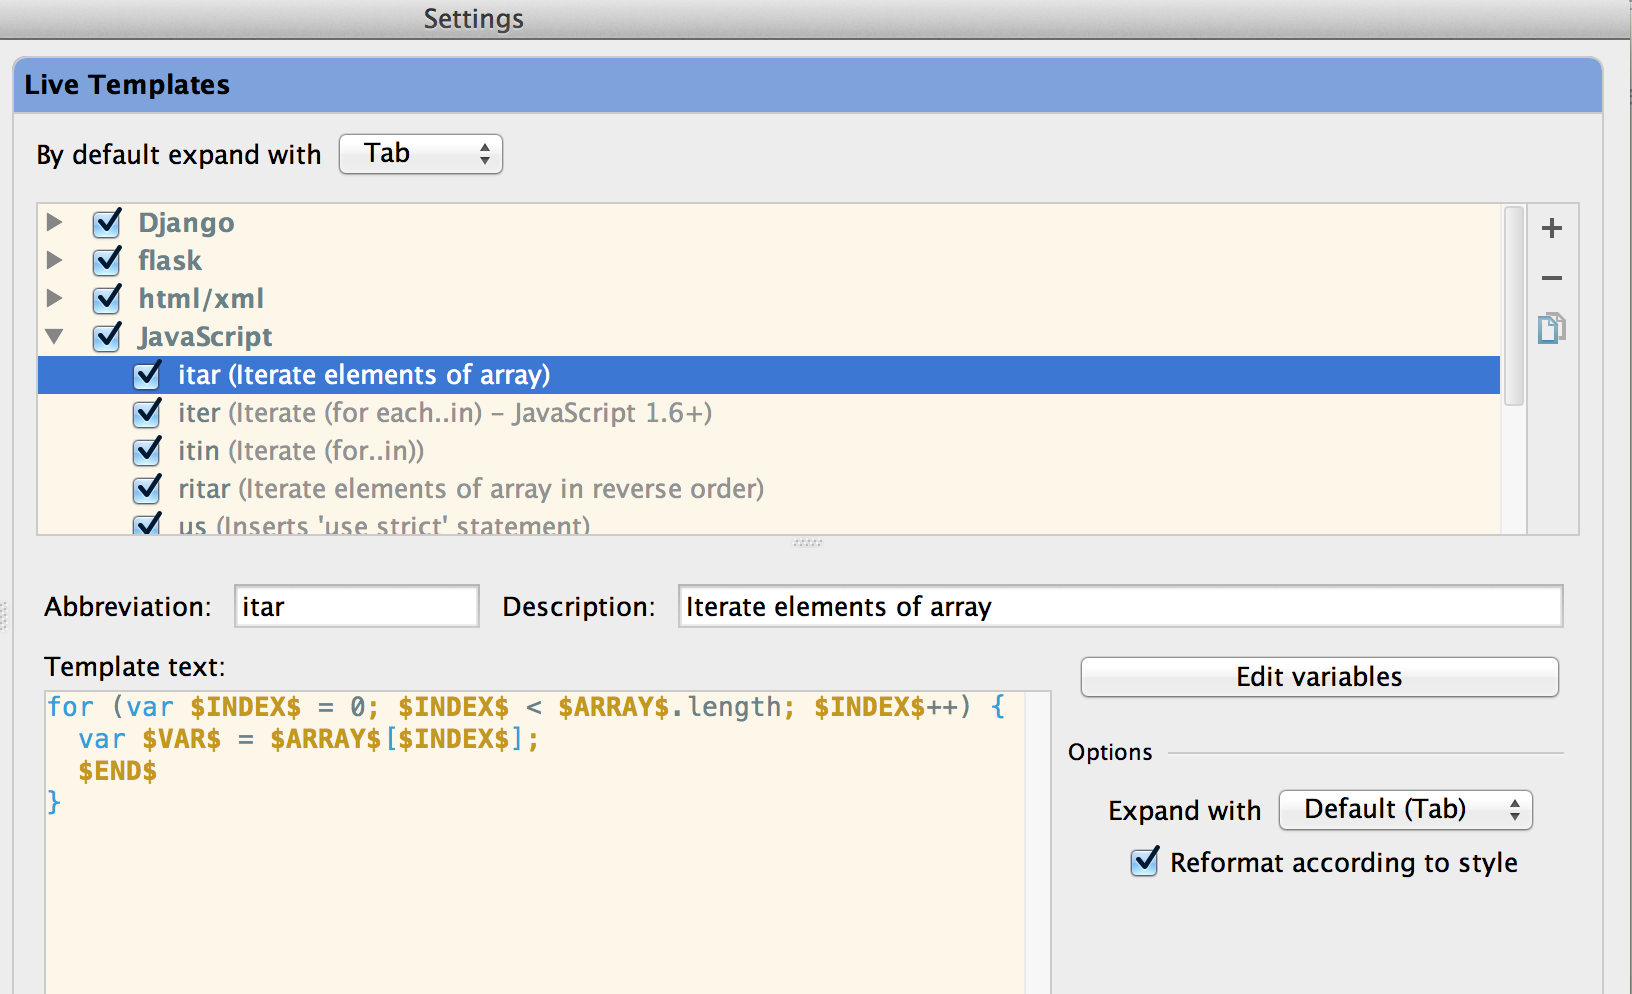
You can’t tell from the screenshot, but that’s actually the extent of the templates for JavaScript. Python — the language this editor was principally designed for — has even less. Just one! All it does is generate a super call for you.
What it Feels Like
It feels the same as any other snippet-like feature you’ve used over the years, but with a GUI for editing and creating them.
Downsides
You can export Live Templates as part of a settings export, into an XML file, but once again, you can’t include them as part of a configuration file in version control that the editor reads and writes to.
The default set of templates is also pretty light. You’ll end up writing a bunch of your own or searching GitHub for someone’s exported settings file designed for a machine to read — ugh.
Running Arbitrary Code (Scratch plugin)
Ok, hold onto your pants — there is no built-in support for creating scratch files.
You read that right. I know, I know, that has to be a terrible lie, right? Well, it’s the truth. To write code in PyCharm you must create a named file that becomes associated with the project. BUT WAIT, THERE’S A PLUGIN.
Fortunately for my sanity, the Scratch plugin adds some nice keyboard shortcuts (and menus) for creating arbitrary files of any type the editor supports, which result in you getting completion and all the other fancy features, as long as you’re referencing symbols that exist in the current project.
What it Feels Like
It felt like a bunch of crap before I found Scratch. Now I don’t really mind, except when I consider that I had to download a plugin just to create a scratch file.
Downsides
Too obvious to mention.
Opening Files from the Command Line
The editor will create a charm binary that you can use to open files in PyCharm from the command line. It works well.
What it Feels Like
Opening files with vim <filename>.
Downsides
Files open in your current project. That’s not always what you want, and I’m not sure if there’s a way to tell charm to launch them in a new project or in a specific project.
Plugins
Compared to Vim, there aren’t many available plugins. This hasn’t been a problem for me because 90% of the features I used plugins for in Vim are either built into the editor or available as a plugin. There may not be a plugin to post to Orkut for you, though. You’ll have to get down in the mud and cut some Java for that one.
The plugins that are available are all discoverable through a configuration panel from within the editor, which is great. They’re searchable and include details about the current plugin version and author.
Here’s the configuration panel that shows your currently installed plugins:
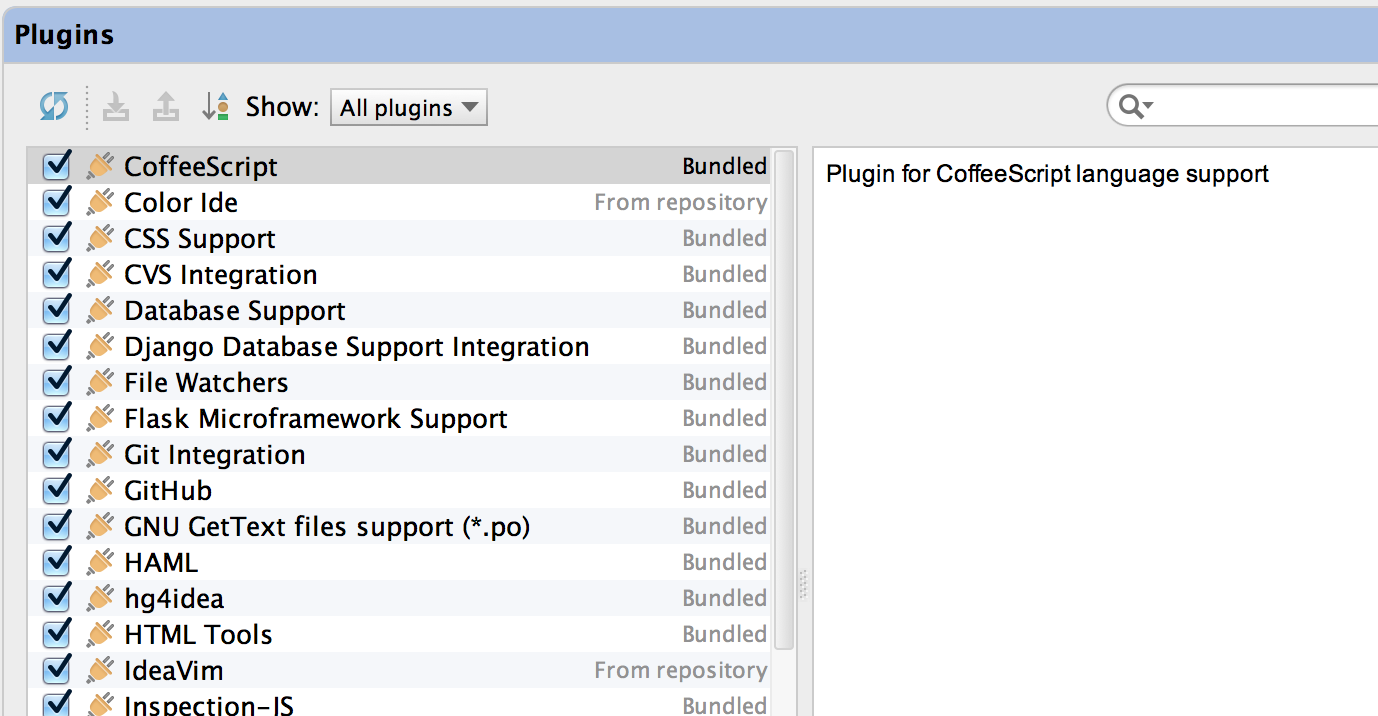
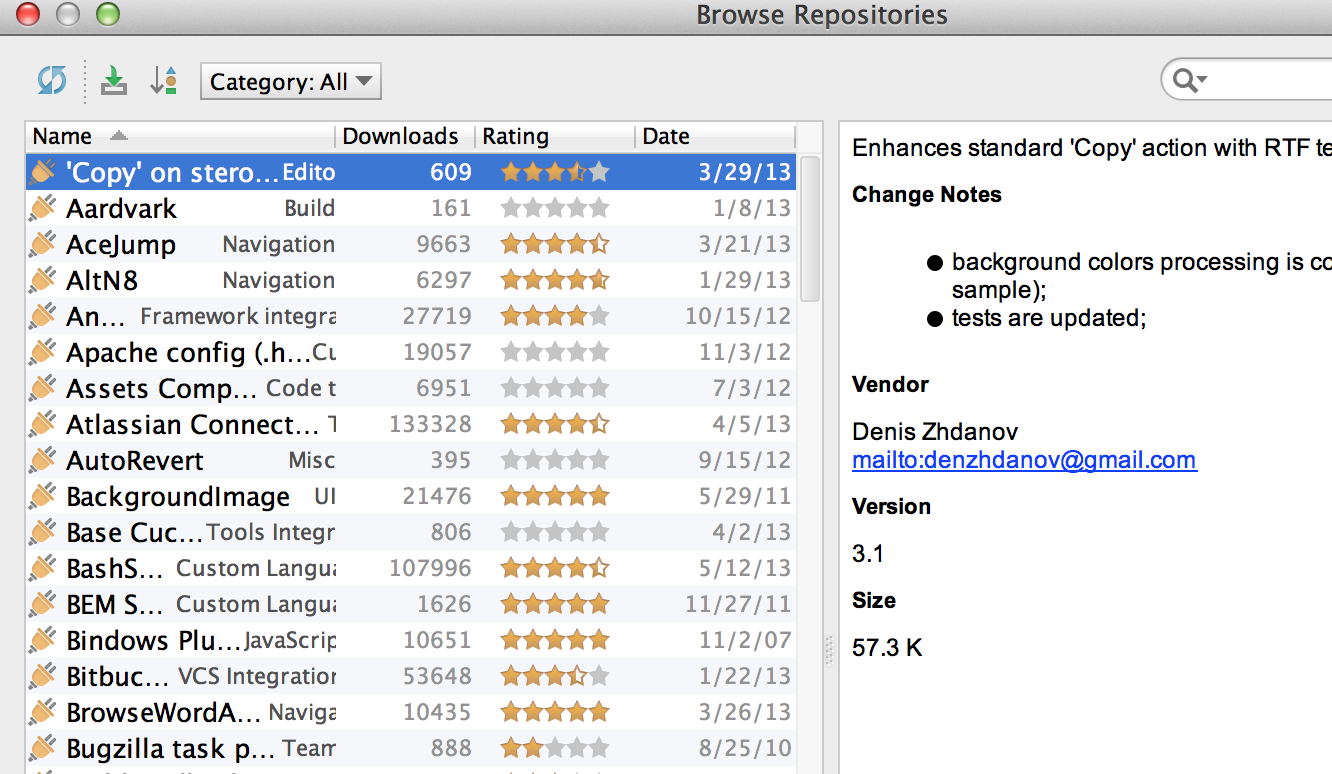
And here’s the panel that opens when you want to search for plugins in the plugin repository:
What it Feels Like
If you use Sublime Text 2 or Emacs, you already have a tool like this, so it will be familiar and perhaps a little troubling, since occasionally you might have to click a mouse button.
Coming from Vim, this was a great feature. I’ve used several plugin management plugins for Vim and they were decent, but usually lacked a good discovery mechanism.
**Update**: As of PyCharm 2.7.3, a great feature of plugin management is that if you export your settings and then import them from a new editor installation, PyCharm will download the plugins for you. Voila!
Downsides
The only problem I had with this feature — an inability to export plugins in a settings file and then automatically download the plugins on a new install — has been added since I wrote this article.
So there aren’t any downsides. Awesome!
Writing Plugins
Unlike Sublime Text 2 or Vim, you have to use an entirely separate editor to edit plugins — Intellij IDEA Community Edition. The good news is that it’s free.
The bad news? You have to write plugins in Java.
I’m going to save additional details about writing plugins for a potential future blog post, after I write a couple more Intellij plugins to get experience. However, in summary I’ll say that I didn’t mind writing Java but I had a hell of a time finding comprehensive documentation on the plugin APIs.
What it Feels Like
It feels like you’re writing Java despite your love of Python. From an entirely different editor with its own configuration file. Because you are.
Downsides
The only real downsides to writing Intellij plugins that I’ve found — in my small amount of experience — are that the API documentation is pretty sparse and you have to upload plugins to a central plugin repository administered by JetBrains. That’s how they make plugins discoverable, and I assume they run some malware detection on uploaded plugins. Right? Right??


